
Google removed average position from Google Ads in late 2019, while not accessible in the interface, it is still possible to quite easily calculate your average position.
What’s Needed
We’re doing this one keyword at a time (but you could if desired collate the results and build a campaign/ad group level report) and as Google are very protective of their auction insights data, we have to do this through the interface. So you need to download:
- Auction insights data (one keyword), segmented by day (any duration)
- Keyword data (same keyword), segmented by day (same duration)
For your Auction insights report, you need the columns: Day (added as a segment when you download your data), Display URL domain, Impression Share, Overlap rate, and Position above rate.
For your keyword report, you need: Day, Keyword, Clicks, Impressions, and Search impr. share (though I’d add everything you can for use later)
How This Works
There’s a direct connection between our average position, and the percentage of impressions competitors purchased where they appeared above us, out of the total impressions all competitors purchased for the same period.
For example, if all of our peers in total purchased 1000 impressions on a single day (in auctions in which we both received an impression – shared auctions), but didn’t outrank us on a single one, we’d know we had an average position of absolute 1. If there are at least five advertisers bidding on five ad slots on a single day; 1000 total peer impressions were purchased and we outranked our peers on 500 of them, we would be calculating that as an average position of 3 (two slots above and two below).
By determining the total amount of impressions our peers (competitor advertisers) purchased on a day, how many of those impressions we appeared above our peers on, and how many ad slots (on average) there were on the same day, we’re able to estimate what our average position would have been.
So using the auction insights data we’re going to calculate, in order:
- Daily keyword search volume
- Total impressions we shared with each competitor by day
- Total no. of shared impressions of each competitor that appeared above us by day
- The average number of ad slots by day
- Average position of our keyword by day
We suggest creating a new workbook and adding individual sheets for both your impression share data and your keyword data, but you can do this however you’d like.
Keyword Search Volume (Search Volume)
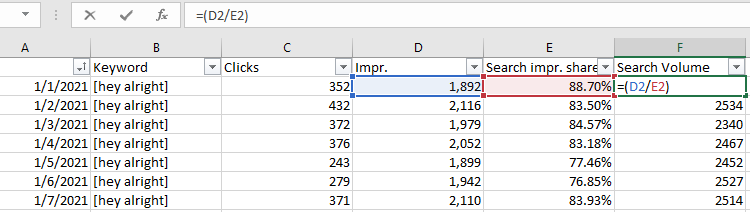
This is a simple one to calculate, add a new column within our keyword report, and divide our impressions by the impression share to get search volume for the keyword for each day. (NB: This isn’t explicitly true, as it’s actually a count of all searches we were eligible to show for, rather than the total searches users performed, though on exact match keywords it will be very close)
Calculating search volume:
Total Impressions Each Competitor Purchased (Peer Impressions)
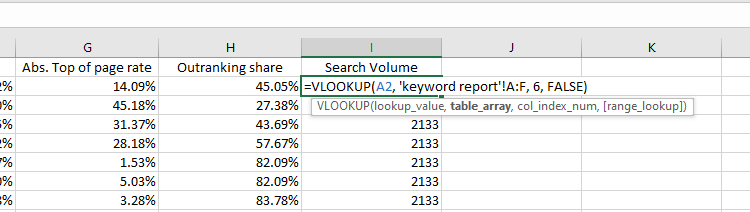
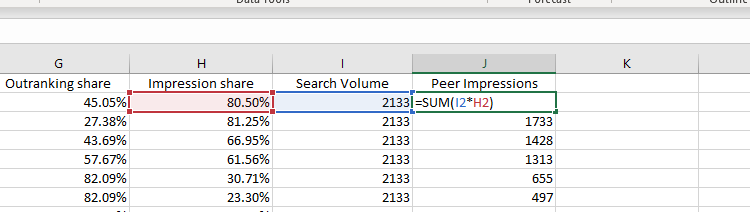
Now by knowing what the true total search volume was on a given day, we can use the competitor impression share to calculate how many impressions each competitor purchased.
To do this, within our auction insights data, we need to add an extra column for “Search Volume”; do a VLOOKUP against our keyword data, using the date, and pull this in.
In cases where the impression share is sub 10% and represented by “<10%”, you’ll want to just copy the data from “Overlap rate” into these cells. We’ll need this metric later to calculate the average number of ad slots there was in every auction we appeared in.
Pulling in your keyword search volume data for each day:
Calculating peer impressions:
Total Competitor Impressions We Appeared in (Total Shared Impressions) by Day
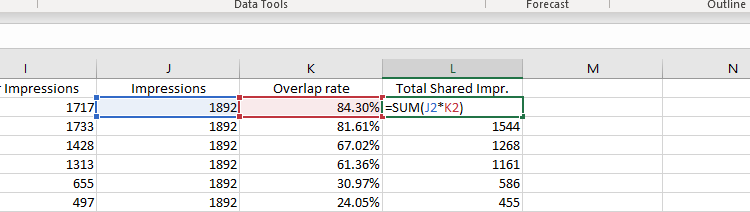
Using our actual impression data, we’re going to times it by the “Overlap rate” to determine the number of impressions we shared with each advertiser. To do this, we need to do another VLOOKUP against our keyword data, using the date again, to pull in keyword impressions by day.
Then we’ll calculate the total shared impressions for each advertiser and each day.
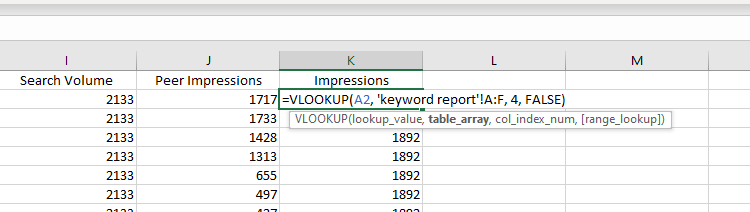
Calculating total shared impressions:
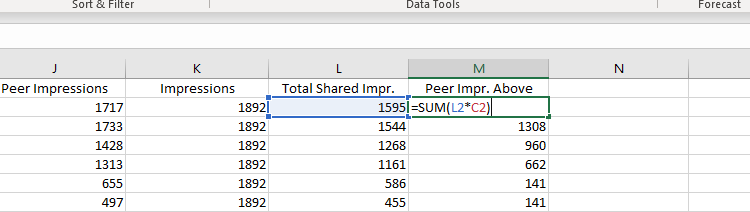
Total No. Of Shared Impressions Where the Competitor Appeared Above Us (Peer Impr. Above) by Day
Now we can take the “Total Shared Impressions” and times it by the “Position above” rate (which is “how often the other participant’s ad was shown in a higher position than yours was, when both of your ads were shown at the same time.”) to get the total number of their impressions in which they appeared above us.
Calculating “Peer impr. above”:
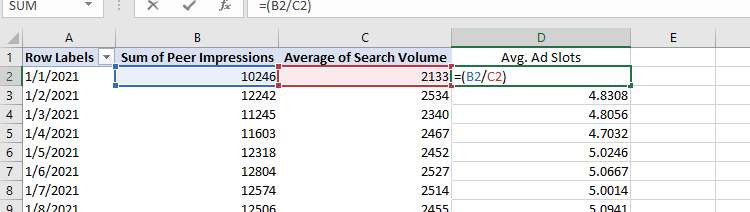
Average Number of Ad Slots (Avg. Ad Slots) by Day
To calculate this, we need to take the total impressions that were purchased by all advertisers (peer and our own), and divide it by the total unique searches each day (“Search Volume”). This will give us the average number of ad slots that appeared in every search .
NB: This isn’t explicitly true, as it’s just average advertiser impressions per auction, and not all ads within each auction would receive an impression 100% of the time, but this is the closest we will get to a usable number (and the result should be very close to what we’re trying to measure).
If you’ve followed the guide closely, you’ll be able to create a pivot table in a new sheet using your auction insights report, and use sum of “Peer Impressions” by day, and an average of “Search Volume” by day (as the search volume is the same for every advertiser for each day, it will be reported accurately using average of when segmenting by day).
Calculating avg. ad slots by day in a new sheet:
Average Position of Our Keyword (Avg. Pos) by Day
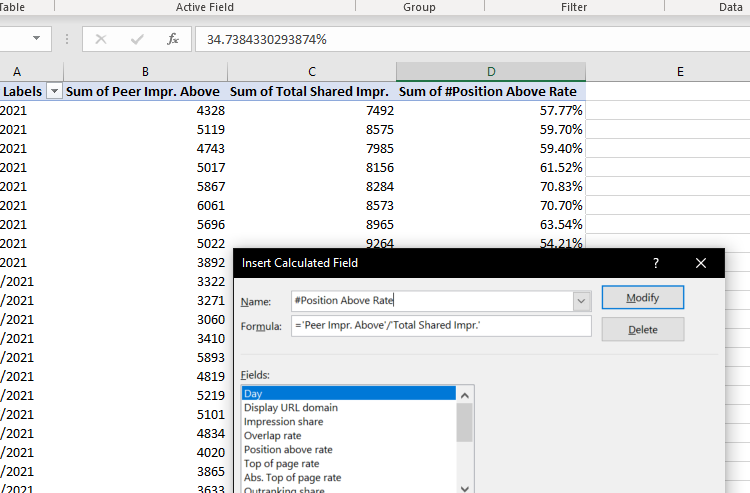
Now we have everything we need, we just have to collate it into one report and do our calculation for average position. First, we need to calculate the “Position above rate” of all shared peer impressions for each day.
Create a new pivot table from your auction insights data, and do a sum of “Peer Impr. Above” by day and another for “Total Shared Impr.”. Add “Day” to rows and plot your two above metrics as values. Add a new calculated field to your pivot table (or calculate this manually outside of your table), for your position above rate (“Peer Impr. Above” divided by “Total Shared Impr.”) as a percentage.
The calculated field:
For the average position calculation, we’re going to times our “Total Pos. Above Rate” by our “Avg. ad slots”, we also need to deduct 1 from the average ad slots and add 1 to our resulting average position calculation as we’re converting to a different scale.
Copy and paste your average ad slots by day data alongside your pivot, and in the column next to it perform this calculation: =((“Avg. ad Slots”-1)*”Impr. Above %”)+1.

Now you should have your average position by day estimate with your date, ready to be used in any form of analysis you’d like. Comparing average position and click-through rate of the keyword is a great place to start; average position vs. impression share, average CPCs and conversion rates might also be insightful.
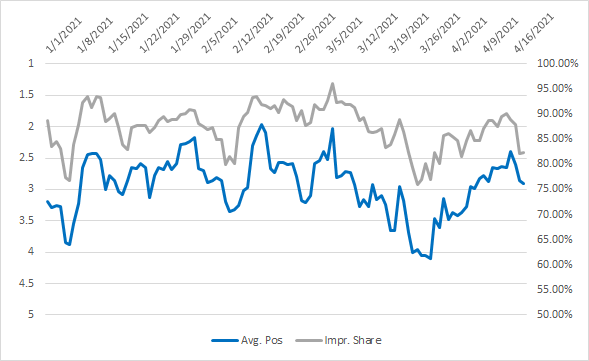
Average position vs. our impression share on the keyword for the period:
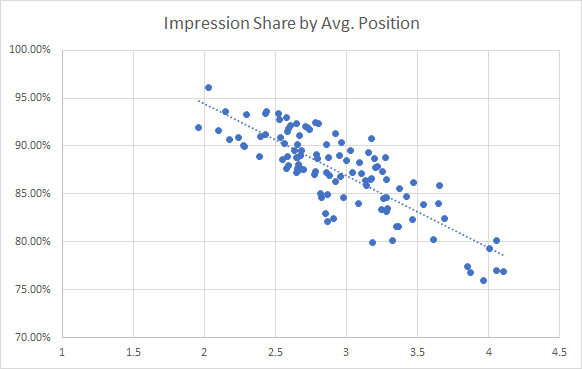
Impression share scales with bidding/ad rank as well as budgets, more so on terms with a large ad depth, here’s the average impr. share by avg. position grouped:
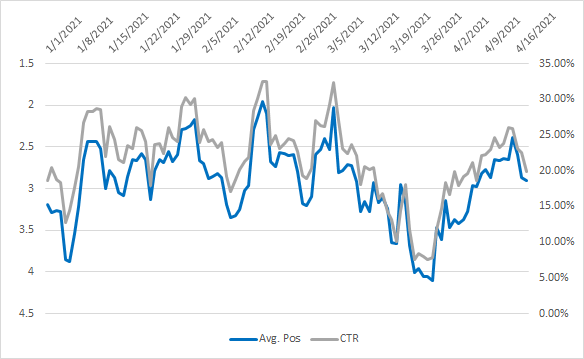
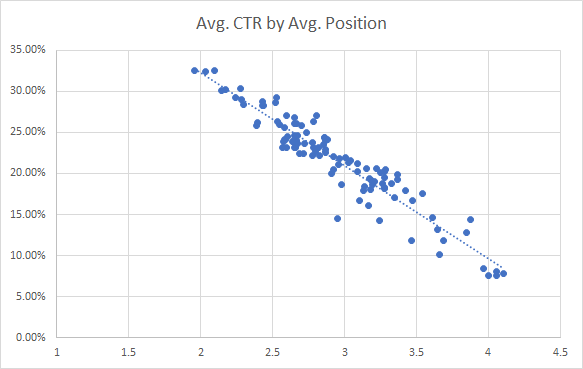
Average click-through rate by average position over the period:
Caveats
I really want to stress the reality of this estimate; it’s built from best (but close) alternatives, it’s based exclusively on the relationship between the total number of auctions we outranked peers vs. the total number of auctions our peers appeared in (that we also appeared in), and the respective average position we would have had to achieve that (all positions being equal – they’re very slightly not). While this has some flaws, it is an accurate representation of ranking relative to the peer group.
